Imagine this: you've invested lakhs in chicks, feed, and shed space, only to watch 15-20% of your batch get rejected at the slaughterhouse or by the market because the birds do not meet the weight standards.
This is not just lost income; it is actually a hidden drain on poultry profitability that nobody discusses in common among integrators.
Batch uniformity scoring changes that. It is not a theoretical term or just an academic term; it is a real-world system to measure just how evenly a flock grows and to predict, with accuracy, which birds are going to fail market specifications well in advance of final flock grading. Commercial poultry farmers who apply this system correctly can shave off a good amount of rejections, turning potential losses into a sure source of liquid cash.
In contract farming, where buyers demand 90% or higher uniformity for A-grade payment, poor batch uniformity means downgrading, fines, or the loss of contracts. Where the industry standard is 75% or higher and defined as birds within ±10% of average weight, most farms have about 65–70% uniformity without systematic measurement and monitoring. This paper presents batch uniformity scoring, describes factors involved in market rejections, and ways to predict—and avoid—such events early on.
What Exactly Is Batch Uniformity Scoring?
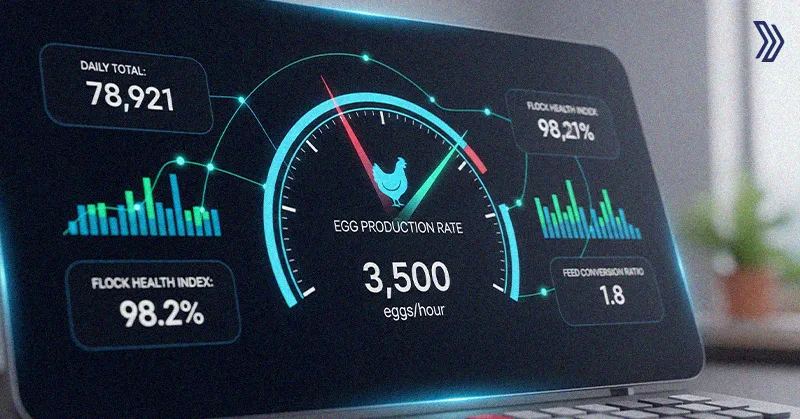
Batch tracking and uniformity isn't about average flock weight; it's about how tightly clustered your birds are around that average.
The standard formula is simple: (Number of birds within ±10% of average weight ÷ Total birds) × 100.
- Score 1 (Excellent): 85%+ uniformity – Minimal rejections, premium pricing
- Score 2 (Good): 75-84% – Industry standard, steady contracts
- Score 3 (Average): 65-74% – Occasional downgrades, margin pressure
- Score 4 (Poor): Below 65% – High rejection risk, contract breaches
Why is this important?
Slaughterhouses provide quality categories based on weight bands. A flock with an average of 2.0 kg but individual birds ranging from 1.4 to 2.6 kg will have about 25–30% of birds outside specifications.
This creates direct losses of per rejected bird and indirect costs from labor and waste in transportation.
Why Uniformity Breaks Down (And Kills Profits)?
Farmers often attribute this to genetics or feed quality, but the actual causes are predictable and can be summarized below:
1. Early Growth Gaps (Weeks 1–2): Larger chicks dominate feeders, causing starvation among the smaller ones. By Day 14, a 10% disparity in weight tends to be irreversible without intervention.
2. Feeding Competition: Small feeder space allows dominant birds to eat 20–30% more, thus poor uniformity is magnified as the smaller birds cannot catch up.
3. Health Variations: The subtle diseases or stress affect weaker birds disproportionately to increase further the gap.
4. Environmental Stress: Temperature spikes or inadequate ventilation disproportionately impact smaller birds and may reduce scores by 5–10 points overnight.
5. Late-Stage Management Errors: Absence of mid-batch sorting prevents corrective action. Farms lacking weekly scoring face pronounced problems at grading.
The math is unforgiving: a lot of 100,000 birds with 70% uniformity can lose over ₹20 lakh because of rejections alone. Integrators can reject such lots or deduct up to ₹5-8 per bird.
The Scoring System: Simple Weekly Checks That Save Lakhs
Step 1: Weekly Weighing (Days 7, 14, 21, 28)
Sample 100-200 birds per shed (5% minimum). Use digital scales for accuracy.
Calculate:
- Average weight
- Birds within ±10% range
- Coefficient of Variation (CV) – target below 8%
Step 2: Assign Uniformity Score
Use the 4-point scale above. Track trends—scores dropping from 85% to 70% between weeks 2-3 signal emergency action.
Step 3: Rejection Risk Prediction
Historical data shows:
- Week 2 score 80%+ → 2-3% final rejection
- Week 2 score 70% → 8-12% rejection
- Week 2 score <65% → 20%+ rejection likely
Pro Tip: CV above 10% by day 21 almost guarantees market failure. Act immediately.
Action Plans for Each Uniformity Crisis
1. Score 1 (<65%) – Red Alert
- Split flock into 3+ weight groups immediately
- Separate feeding: Bigger birds get restricted access, smaller get starter diet
- Add electrolytes/vitamins to catch-up birds
- Expect 15%+ rejection without action
2. Score 2 (65-74%) – Yellow Warning
- Grade into 2 groups (light/heavy)
- Adjust feeder space: 6-7cm/bird for lights, 5cm/bird for heavies
- Target 5% weight gain boost for small birds
3. Score 3 (75-84%) – Green Zone
- Maintain current management
- Monitor daily weight gain curves and keep flocks healthy
- Weekly scoring continues
Market Rejection Prediction: The 80/20 Rule
Data from 500+ Indian batches shows Week 2 uniformity predicts 80% of final rejection risk.
Farms scoring below 75% at day 14 have 87% chance of missing contract weights. Here's the prediction table:
Week 2 Uniformity | Predicted Rejection | Action Priority |
|---|
85%+ | 1-3% | Monitor |
|---|
75-84% | 4-8% | Sort |
|---|
65-74% | 9-15% | Urgent split |
|---|
<65% | 16-25%+ | Crisis Management |
|---|
This foresight lets you renegotiate contracts, sell seconds early, or push premium batches to better buyers.
How Livine Software Transforms Uniformity Management
Manual scoring works for small farms, but contract integrators managing 50+ batches need Livine Poultry Software.
Here's how Livine eliminates guesswork:
1. Automated Weekly Scoring
Livine's Grower app lets field managers weigh 100 birds in 15 minutes. Cloud Poultry ERP software dashboard calculates uniformity scores instantly across all farms. No Excel, no errors.
2. Real-Time Rejection Forecasting
Livine predicts market rejection risk for each batch based on 2+ years of your farm data.
Get alerts: "Batch #47: 82% risk of missing 2.1kg contract weight."
3. Smart Sorting Recommendations
AI analyzes weight curves and suggests exact split points: "Grade Batch #23: 42% lights to Shed A, 58% heavies to Shed B." Includes feeder space recalculations.
4. Contractor Ranking
Livine ranks your 50+ contract farms by uniformity trends. Top performers get premium chicks/feed; bottom 10% get training or replacement.
5. Historical Rejection Analytics
See which farms consistently deliver 85%+ scores vs. chronic 65% failures. Correlate with feed suppliers, chick batches, management practices.
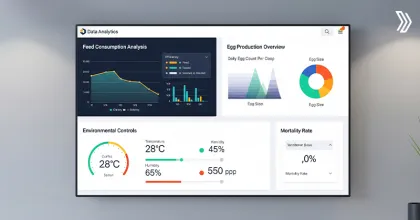
Livine Features You'll Love:
- Batch Heatmaps: Visual uniformity trends across all sheds/farms
- Rejection Risk Alerts: SMS when scores drop below 75%
- Auto-Reports: Share scoring data with buyers/integrators
- Mobile Weighing: Works offline, syncs when connected
Implementation Roadmap (30 Days to Results)
- Week 1: Install Livine Grower app on all farm phones. Train managers on 5-minute weighing protocol.
- Week 2: Baseline scoring across all batches. Identify your worst 10 farms.
- Week 3: Execute Livine sorting recommendations. Monitor weight gain recovery.
- Week 4: First market grading with predicted outcomes. Calculate ROI.
Expect 6-10% rejection reduction immediately, scaling to 12-15% within 3 months.